Results
Ground-truth
MTGS-PP
Ours
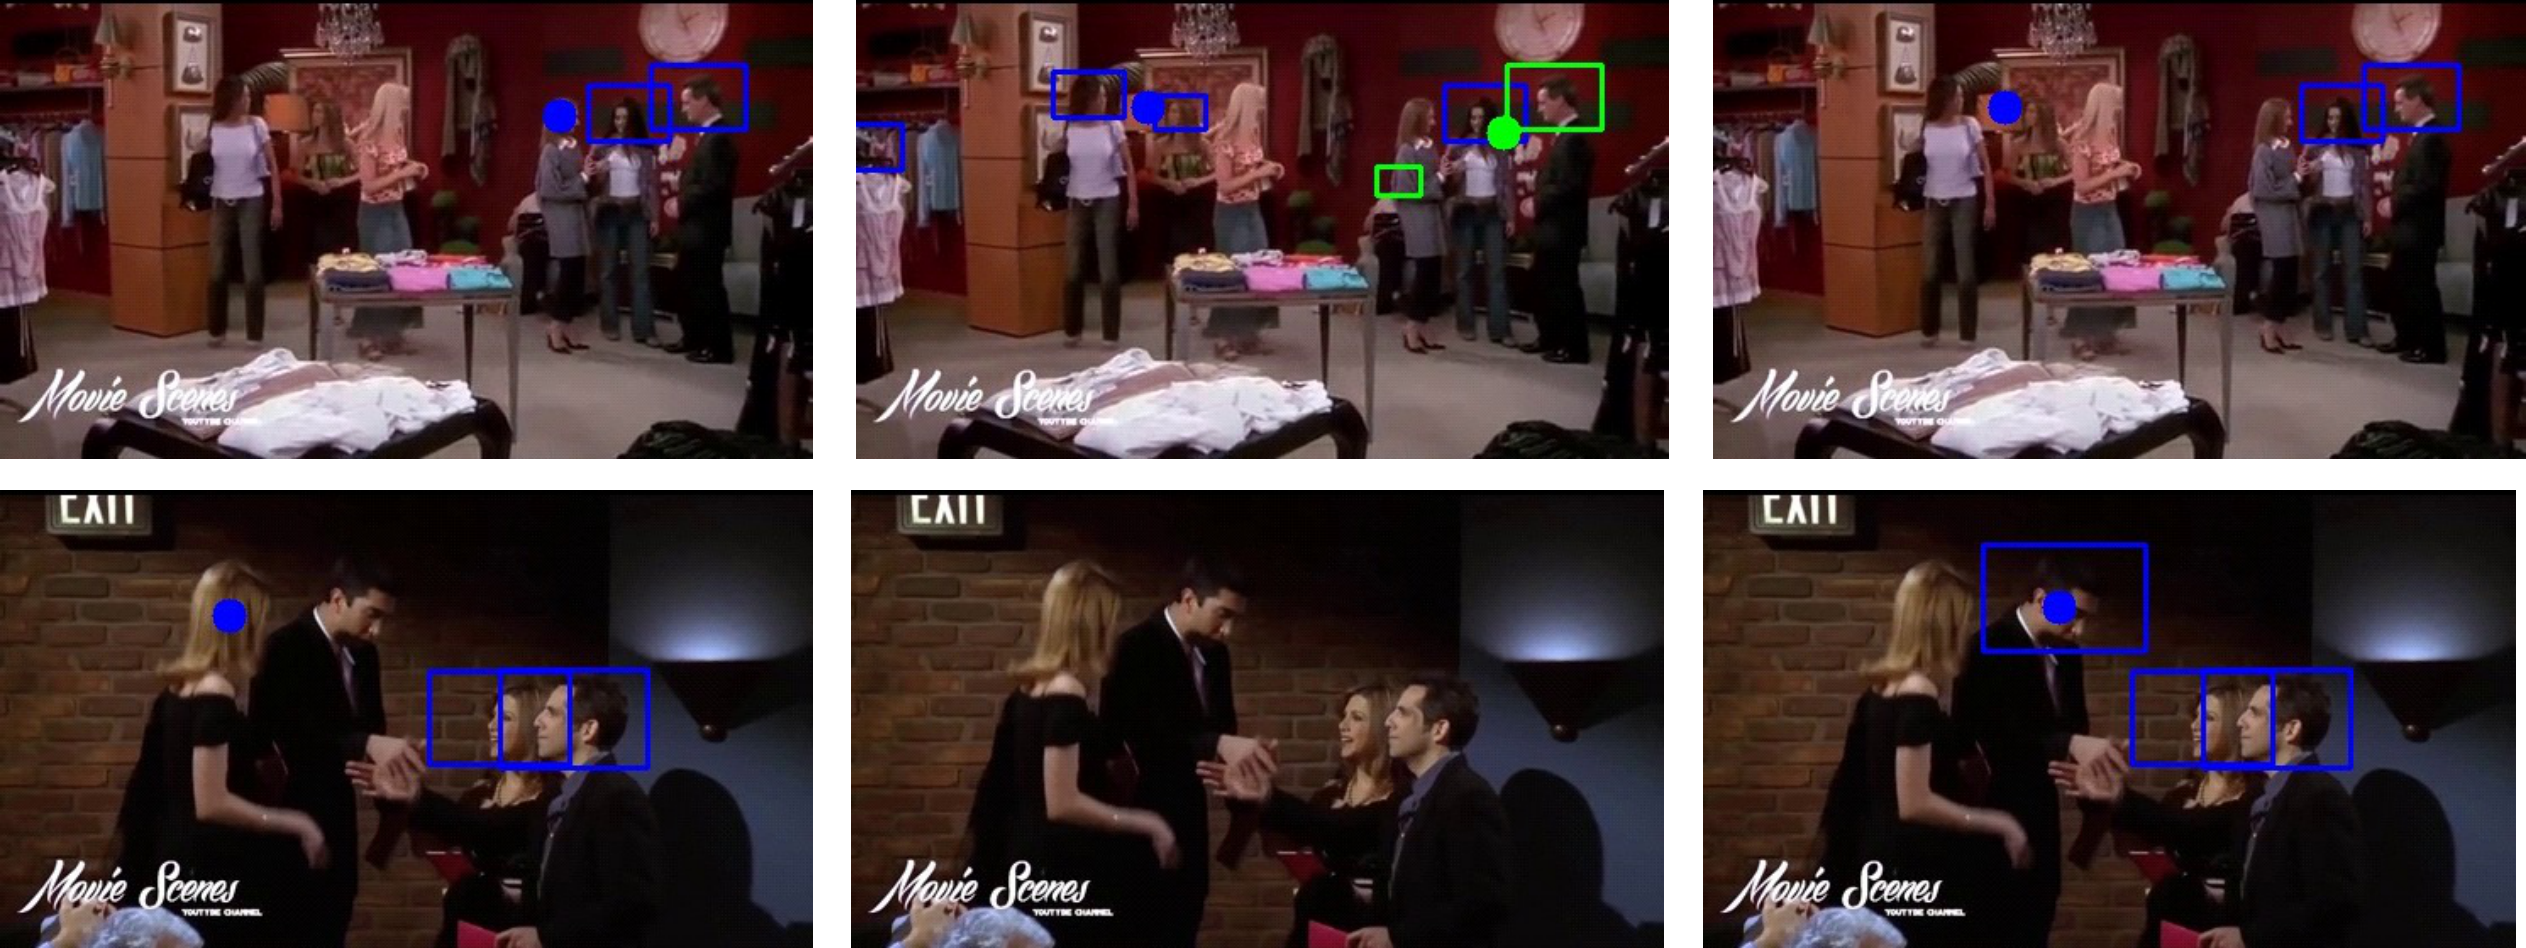
Figure 3.
Visual comparison on the VideoCoAtt dataset. People joining the same group are enclosed within a
rectangle of the same color. The estimated shared attention point for each group is visualized as a
colored dot. Our method correctly detects groups and localizes shared attention targets where
competing methods fail.
Quantitative Results — VideoCoAtt Dataset
| Method |
θIoU = 0.5 |
θIoU = 1.0 |
| θDist=0.05 |
θDist=0.1 |
θDist=∞ |
θDist=0.05 |
θDist=0.1 |
θDist=∞ |
| MTGS-PP [NeurIPS 2024] |
16.4 | 20.7 | 37.5 |
7.1 | 8.6 | 11.3 |
| MTGS-Soc. [NeurIPS 2024] |
5.7 | 7.8 | 28.6 |
2.9 | 3.6 | 9.8 |
| Gaze-LLE-PP [CVPR 2025] |
15.6 | 19.5 | 26.3 |
5.7 | 6.9 | 8.2 |
| ★ Ours |
32.4 |
41.0 |
61.7 |
12.5 |
15.9 |
17.7 |
Table 1.
GroupAP (%) comparison on the VideoCoAtt dataset. Our method outperforms all baselines across
every setting. Results in red indicate the best score per column.
Quantitative Results — VideoAttentionTarget Dataset
| Method |
θIoU = 0.5 |
θIoU = 1.0 |
| θDist=0.05 |
θDist=0.1 |
θDist=∞ |
θDist=0.05 |
θDist=0.1 |
θDist=∞ |
| MTGS-PP |
30.3 | 35.6 | 66.0 |
5.1 | 6.3 | 9.0 |
| MTGS-Soc. |
7.6 | 9.9 | 37.2 |
1.5 | 1.9 | 4.7 |
| Gaze-LLE-PP |
7.5 | 8.5 | 12.4 |
2.9 | 3.0 | 3.3 |
| ★ Ours |
27.2 | 33.5 | 52.0 |
7.5 |
10.1 |
12.0 |
Table 2.
GroupAP (%) on the VideoAttentionTarget dataset.
Our method achieves the best performance under strict group detection criteria (θIoU = 1.0).
Quantitative Results — ChildPlay Dataset
| Method |
θIoU = 0.5 |
θIoU = 1.0 |
| θDist=0.05 |
θDist=0.1 |
θDist=∞ |
θDist=0.05 |
θDist=0.1 |
θDist=∞ |
| MTGS-PP |
7.8 | 13.9 | 25.4 |
4.6 | 5.2 | 5.6 |
| MTGS-Soc. |
0.8 | 1.8 | 9.1 |
0.7 | 0.7 | 1.3 |
| Gaze-LLE-PP |
5.8 | 8.1 | 14.1 |
2.4 | 2.8 | 4.4 |
| ★ Ours |
9.0 |
15.6 |
36.3 |
2.1 | 2.1 | 2.4 |
Table 3.
GroupAP (%) on the ChildPlay dataset.
Our method achieves best performance under lenient criteria (θIoU = 0.5),
especially at θDist = ∞ (36.3% vs. 25.4% for the best baseline).